An R package to create nice looking output for CFA and SEM analyses using lavaan and semPlot packages
Install
devtools::install_github("dr-JT/semoutput")Required Packages
lavaan package to run CFA and SEM analyses
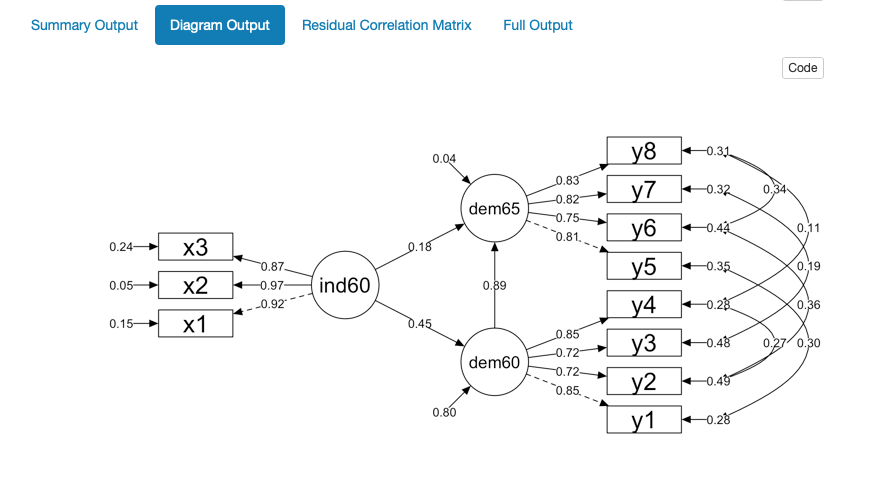
semPlot package to display model diagrams
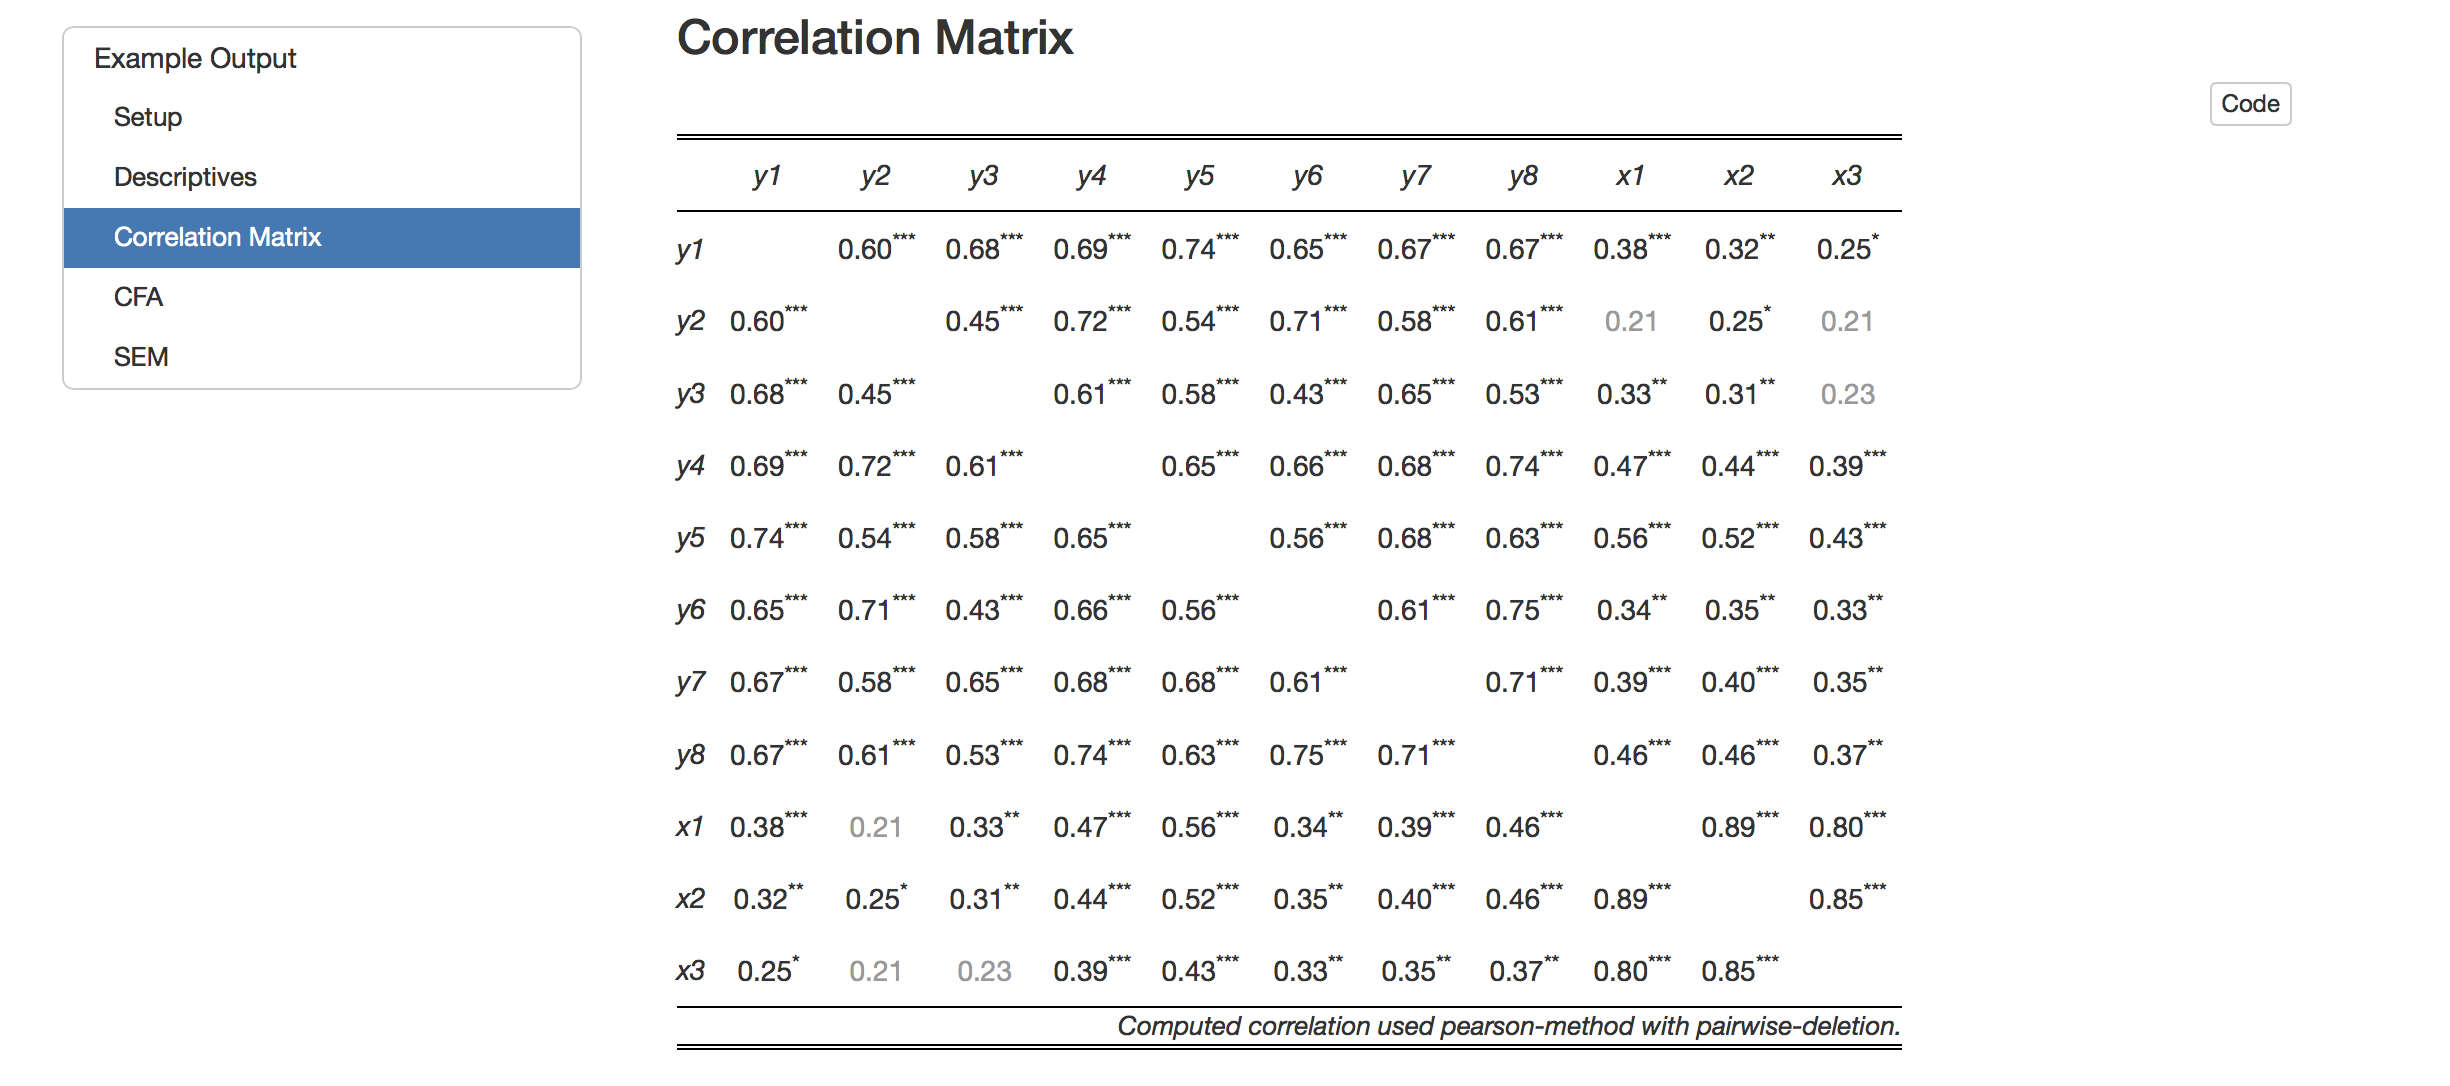
sjPlot package to print correlation tables
Usage
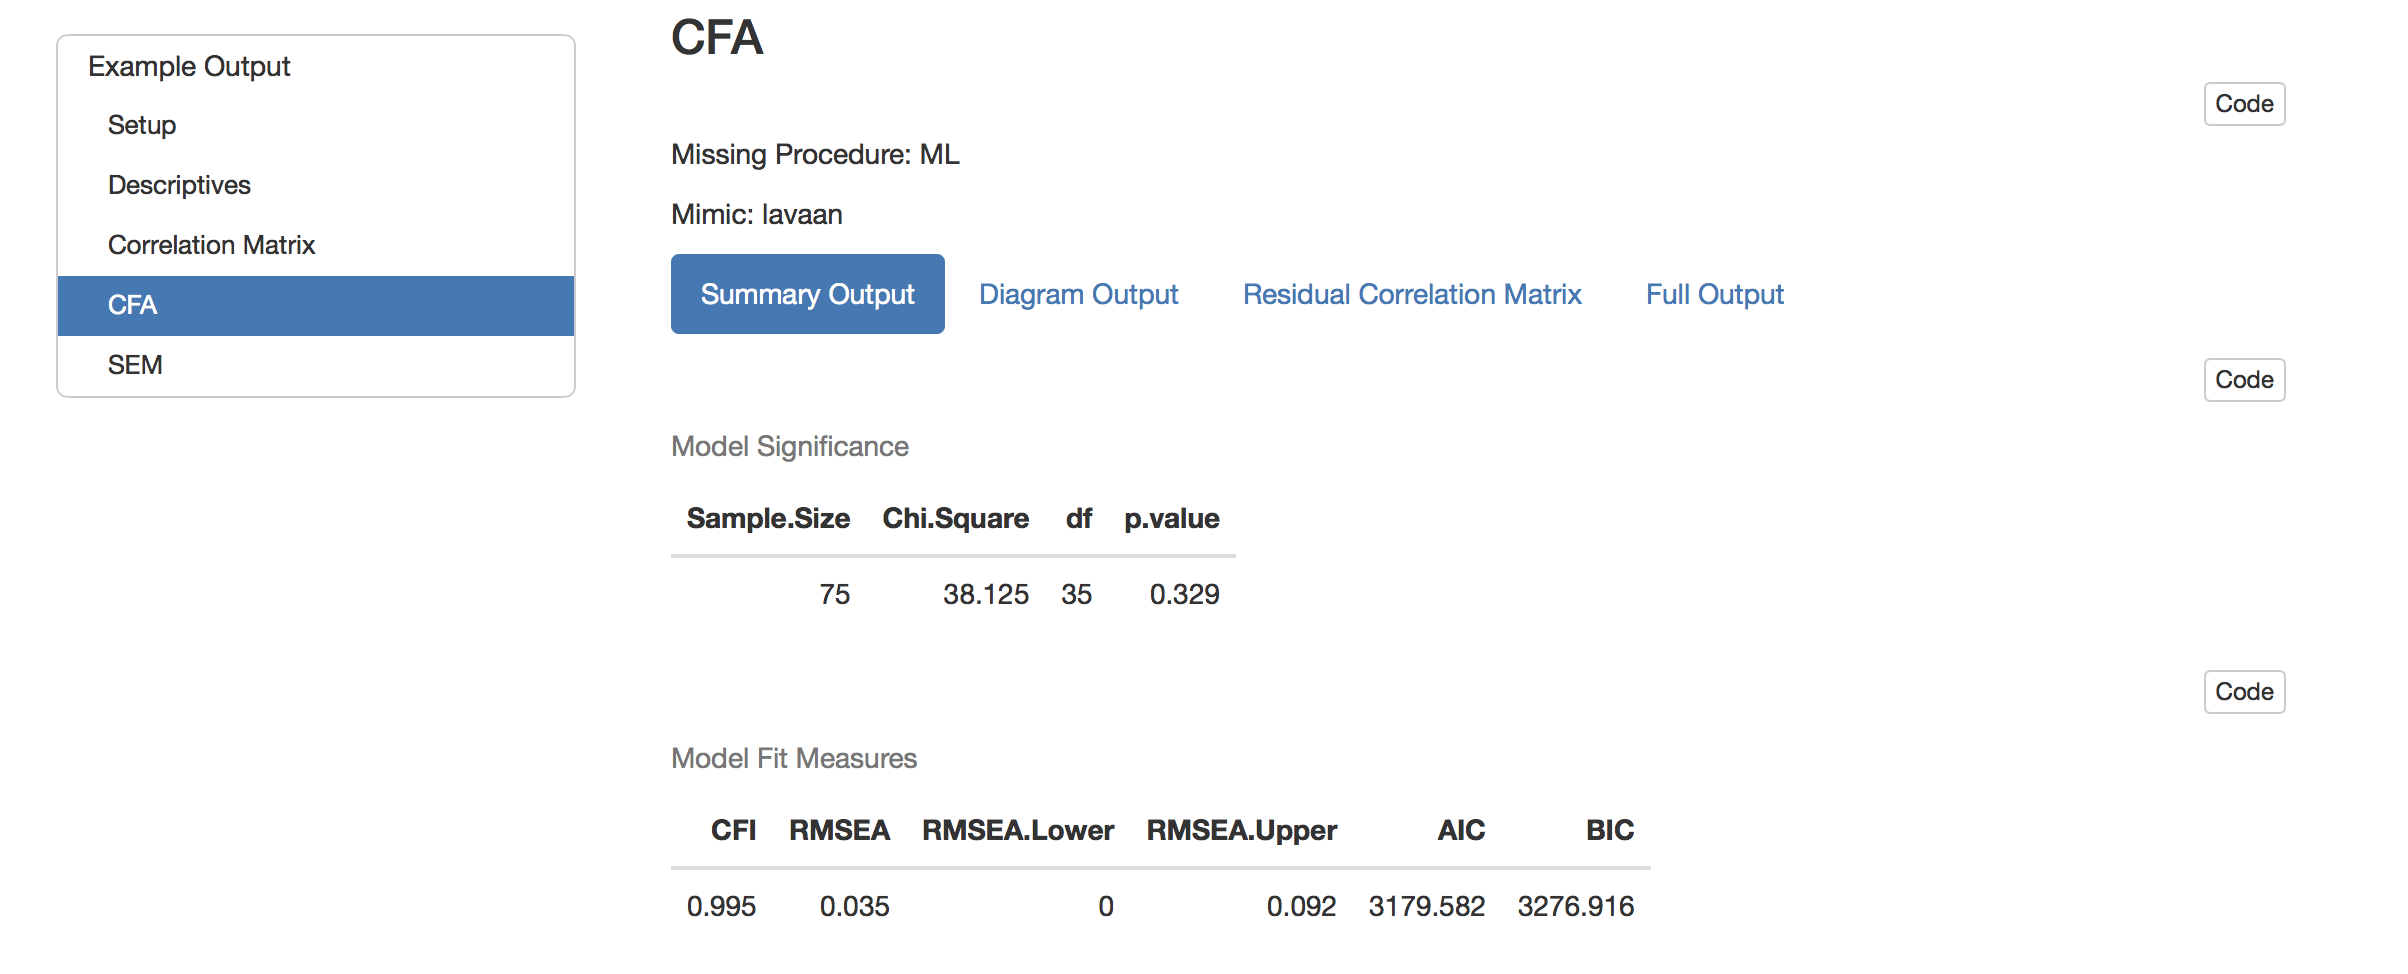
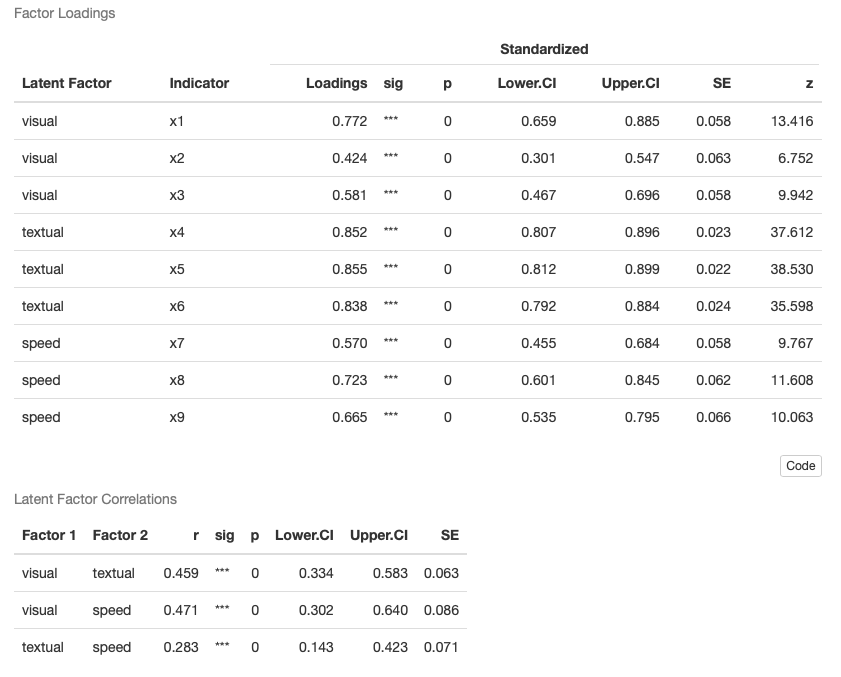
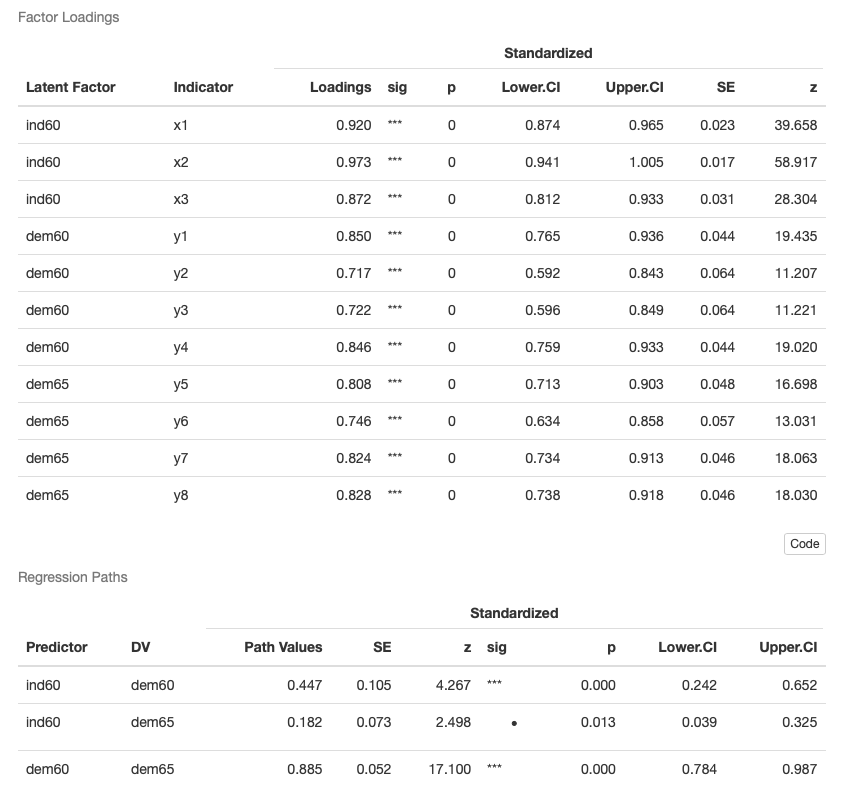
Use a single function sem_tables() to display nice looking output from a lavaan model.
The package contains an RMarkdwon template that makes it very easy to run CFA and SEM analyses in R and create nice looking output.
Once you install the package, you will be able to access the R Markdown template by going to:
File -> New File -> R Markdown… -> From Template -> CFA/SEM (lavaan)
lavaan
lavaan syntax is very intuitive to use and is documented with useful tutorials
http://lavaan.ugent.be/tutorial/index.html
Example lavaan syntax
CFA
# Specify the model parameters using intuitive syntax to write out equations
model <- '
# latent factors
f1 =~ v1 + v2 + v3
f2 =~ v4 + v5 + v6
f3 =~ v7 + v8 + v9

# correlated errors
v5 ~~ v6
v7 ~~ v8
'

# Run a latent variable analysis
fit <- cfa(model, data = data, missing = "ML", std.lv = FALSE)

# Print styled tables
sem_tables(fit)