Import Data
For this example I am using the PoliticalDemocracy data set from the lavaan package.
Descriptives
Descriptive Statistics
|
Variable
|
n
|
Mean
|
SD
|
min
|
max
|
Skewness
|
Kurtosis
|
% Missing
|
|
x1
|
75
|
5.05
|
0.73
|
3.78
|
6.74
|
0.26
|
-0.69
|
0
|
|
x2
|
75
|
4.79
|
1.51
|
1.39
|
7.87
|
-0.36
|
-0.50
|
0
|
|
x3
|
75
|
3.56
|
1.41
|
1.00
|
6.42
|
0.09
|
-0.88
|
0
|
|
y1
|
75
|
5.46
|
2.62
|
1.25
|
10.00
|
-0.10
|
-1.10
|
0
|
|
y2
|
75
|
4.26
|
3.95
|
0.00
|
10.00
|
0.33
|
-1.43
|
0
|
|
y3
|
75
|
6.56
|
3.28
|
0.00
|
10.00
|
-0.62
|
-0.66
|
0
|
|
y4
|
75
|
4.45
|
3.35
|
0.00
|
10.00
|
0.12
|
-1.16
|
0
|
|
y5
|
75
|
5.14
|
2.61
|
0.00
|
10.00
|
-0.24
|
-0.72
|
0
|
|
y6
|
75
|
2.98
|
3.37
|
0.00
|
10.00
|
0.93
|
-0.40
|
0
|
|
y7
|
75
|
6.20
|
3.29
|
0.00
|
10.00
|
-0.58
|
-0.67
|
0
|
|
y8
|
75
|
4.04
|
3.25
|
0.00
|
10.00
|
0.46
|
-0.91
|
0
|
Correlation Matrix
|
|
y1
|
y2
|
y3
|
y4
|
y5
|
y6
|
y7
|
y8
|
x1
|
x2
|
x3
|
|
y1
|
|
0.60***
|
0.68***
|
0.69***
|
0.74***
|
0.65***
|
0.67***
|
0.67***
|
0.38***
|
0.32**
|
0.25*
|
|
y2
|
0.60***
|
|
0.45***
|
0.72***
|
0.54***
|
0.71***
|
0.58***
|
0.61***
|
0.21
|
0.25*
|
0.21
|
|
y3
|
0.68***
|
0.45***
|
|
0.61***
|
0.58***
|
0.43***
|
0.65***
|
0.53***
|
0.33**
|
0.31**
|
0.23
|
|
y4
|
0.69***
|
0.72***
|
0.61***
|
|
0.65***
|
0.66***
|
0.68***
|
0.74***
|
0.47***
|
0.44***
|
0.39***
|
|
y5
|
0.74***
|
0.54***
|
0.58***
|
0.65***
|
|
0.56***
|
0.68***
|
0.63***
|
0.56***
|
0.52***
|
0.43***
|
|
y6
|
0.65***
|
0.71***
|
0.43***
|
0.66***
|
0.56***
|
|
0.61***
|
0.75***
|
0.34**
|
0.35**
|
0.33**
|
|
y7
|
0.67***
|
0.58***
|
0.65***
|
0.68***
|
0.68***
|
0.61***
|
|
0.71***
|
0.39***
|
0.40***
|
0.35**
|
|
y8
|
0.67***
|
0.61***
|
0.53***
|
0.74***
|
0.63***
|
0.75***
|
0.71***
|
|
0.46***
|
0.46***
|
0.37**
|
|
x1
|
0.38***
|
0.21
|
0.33**
|
0.47***
|
0.56***
|
0.34**
|
0.39***
|
0.46***
|
|
0.89***
|
0.80***
|
|
x2
|
0.32**
|
0.25*
|
0.31**
|
0.44***
|
0.52***
|
0.35**
|
0.40***
|
0.46***
|
0.89***
|
|
0.85***
|
|
x3
|
0.25*
|
0.21
|
0.23
|
0.39***
|
0.43***
|
0.33**
|
0.35**
|
0.37**
|
0.80***
|
0.85***
|
|
|
Computed correlation used pearson-method with pairwise-deletion.
|
CFA
Summary Output
Model Significance
|
Sample.Size
|
Chi.Square
|
df
|
p.value
|
|
75
|
38.125
|
35
|
0.329
|
Model Fit Measures
|
CFI
|
RMSEA
|
RMSEA.Lower
|
RMSEA.Upper
|
AIC
|
BIC
|
|
0.995
|
0.035
|
0
|
0.092
|
3179.582
|
3276.916
|
Factor Loadings
|
|
|
Loadings
|
|
|
Latent Factor
|
Indicator
|
Standardized
|
Unstandardized
|
SE
|
z
|
sig
|
|
ind60
|
x1
|
0.920
|
0.670
|
0.065
|
10.339
|
***
|
|
ind60
|
x2
|
0.973
|
1.460
|
0.128
|
11.423
|
***
|
|
ind60
|
x3
|
0.872
|
1.218
|
0.128
|
9.489
|
***
|
|
dem60
|
y1
|
0.850
|
2.223
|
0.253
|
8.789
|
***
|
|
dem60
|
y2
|
0.717
|
2.794
|
0.408
|
6.850
|
***
|
|
dem60
|
y3
|
0.722
|
2.351
|
0.341
|
6.902
|
***
|
|
dem60
|
y4
|
0.846
|
2.812
|
0.324
|
8.677
|
***
|
|
dem65
|
y5
|
0.808
|
2.103
|
0.256
|
8.210
|
***
|
|
dem65
|
y6
|
0.746
|
2.493
|
0.341
|
7.320
|
***
|
|
dem65
|
y7
|
0.824
|
2.691
|
0.319
|
8.441
|
***
|
|
dem65
|
y8
|
0.828
|
2.662
|
0.316
|
8.430
|
***
|
Latent Factor Correlations
|
Factor 1
|
Factor 2
|
r
|
sig
|
|
ind60
|
dem60
|
0.447
|
***
|
|
ind60
|
dem65
|
0.578
|
***
|
|
dem60
|
dem65
|
0.967
|
***
|
Latent Factor Variance/Residual Variance
|
Factor 1
|
Factor 2
|
var
|
var.std
|
sig
|
|
R-Squared Values
|
Variable
|
R-Squared
|
|
x1
|
0.8461294
|
|
x2
|
0.9467924
|
|
x3
|
0.7606256
|
|
y1
|
0.7232242
|
|
y2
|
0.5142640
|
|
y3
|
0.5217883
|
|
y4
|
0.7152245
|
|
y5
|
0.6528920
|
|
y6
|
0.5565270
|
|
y7
|
0.6784378
|
|
y8
|
0.6853215
|
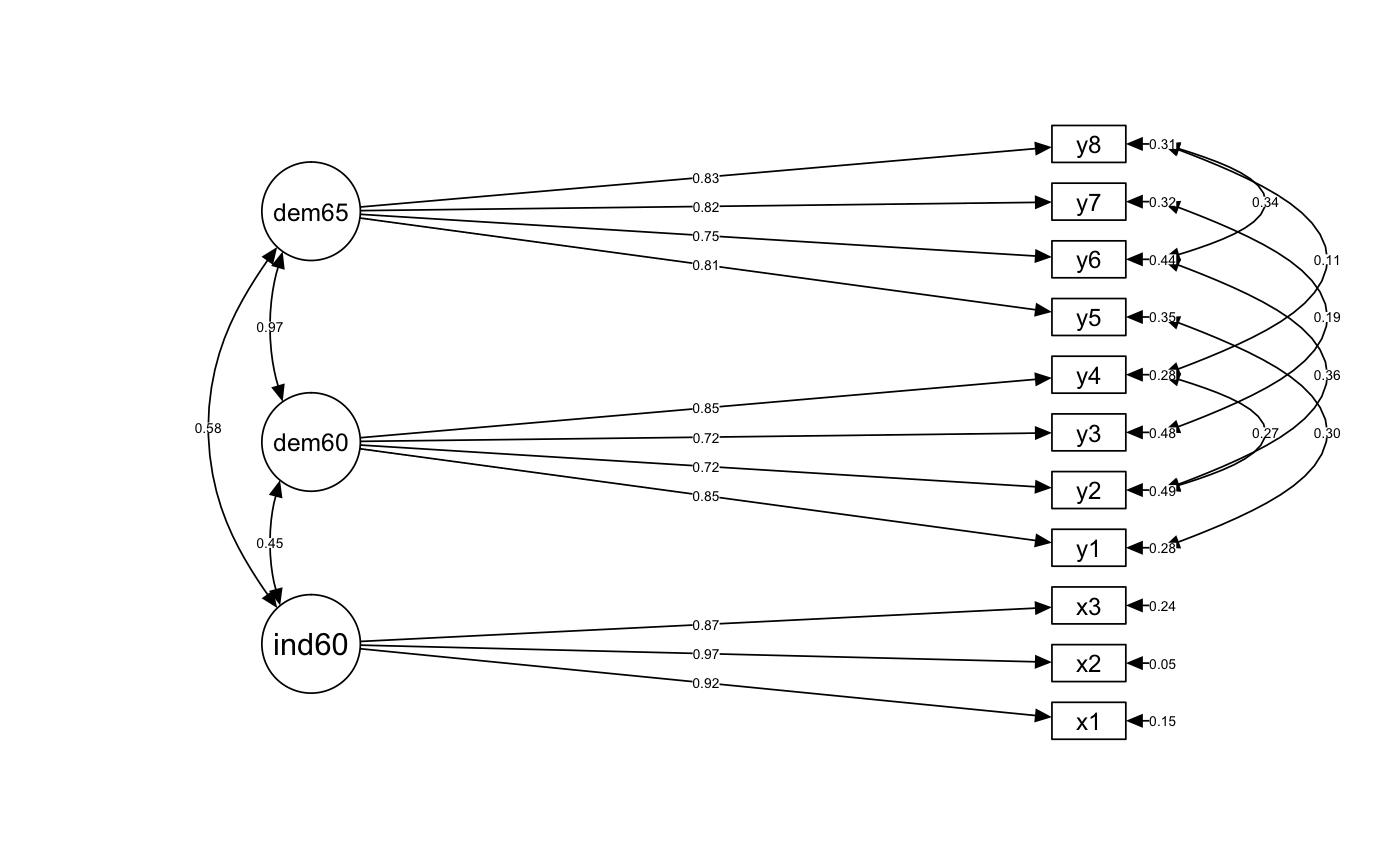
Diagram Output
semPaths(fit, whatLabels = "std", edge.label.cex = .5, layout = "tree2", rotation = 2, style = "lisrel", intercepts = FALSE, residuals = TRUE, curve = 1, curvature = 3, nCharNodes = 8, sizeMan = 6, sizeMan2 = 3, optimizeLatRes = TRUE, edge.color = "#000000", latents = factors)
Residual Correlation Matrix
|
|
x1
|
x2
|
x3
|
y1
|
y2
|
y3
|
y4
|
y5
|
y6
|
y7
|
y8
|
|
x1
|
|
|
|
|
|
|
|
|
|
|
|
|
x2
|
0.00
|
|
|
|
|
|
|
|
|
|
|
|
x3
|
0.00
|
0.00
|
|
|
|
|
|
|
|
|
|
|
y1
|
0.03
|
-0.05
|
-0.08
|
|
|
|
|
|
|
|
|
|
y2
|
-0.08
|
-0.06
|
-0.07
|
-0.01
|
|
|
|
|
|
|
|
|
y3
|
0.03
|
0.00
|
-0.06
|
0.06
|
-0.07
|
|
|
|
|
|
|
|
y4
|
0.12
|
0.08
|
0.06
|
-0.03
|
0.01
|
0.00
|
|
|
|
|
|
|
y5
|
0.14
|
0.07
|
0.02
|
-0.02
|
-0.02
|
0.01
|
-0.01
|
|
|
|
|
|
y6
|
-0.05
|
-0.06
|
-0.04
|
0.04
|
0.02
|
-0.09
|
0.05
|
-0.04
|
|
|
|
|
y7
|
-0.05
|
-0.06
|
-0.06
|
0.00
|
0.01
|
0.00
|
0.01
|
0.01
|
-0.01
|
|
|
|
y8
|
0.02
|
-0.01
|
-0.05
|
-0.01
|
0.03
|
-0.05
|
0.03
|
-0.04
|
0.01
|
0.03
|
|
Full Output
## lavaan 0.6-3 ended normally after 75 iterations
##
##   Optimization method                           NLMINB
##   Number of free parameters                         42
##
##   Number of observations                            75
##   Number of missing patterns                         1
##
##   Estimator                                         ML
##   Model Fit Test Statistic                      38.125
##   Degrees of freedom                                35
##   P-value (Chi-square)                           0.329
##
## Model test baseline model:
##
##   Minimum Function Test Statistic              730.654
##   Degrees of freedom                                55
##   P-value                                        0.000
##
## User model versus baseline model:
##
##   Comparative Fit Index (CFI)                    0.995
##   Tucker-Lewis Index (TLI)                       0.993
##
## Loglikelihood and Information Criteria:
##
##   Loglikelihood user model (H0)              -1547.791
##   Loglikelihood unrestricted model (H1)      -1528.728
##
##   Number of free parameters                         42
##   Akaike (AIC)                                3179.582
##   Bayesian (BIC)                              3276.916
##   Sample-size adjusted Bayesian (BIC)         3144.543
##
## Root Mean Square Error of Approximation:
##
##   RMSEA                                          0.035
##   90 Percent Confidence Interval          0.000  0.092
##   P-value RMSEA <= 0.05                          0.611
##
## Standardized Root Mean Square Residual:
##
##   SRMR                                           0.041
##
## Parameter Estimates:
##
##   Information                                 Observed
##   Observed information based on                Hessian
##   Standard Errors                             Standard
##
## Latent Variables:
##                    Estimate  Std.Err  z-value  P(>|z|)   Std.lv  Std.all
##   ind60 =~
##     x1                0.670    0.065   10.339    0.000    0.670    0.920
##     x2                1.460    0.128   11.423    0.000    1.460    0.973
##     x3                1.218    0.128    9.489    0.000    1.218    0.872
##   dem60 =~
##     y1                2.223    0.253    8.789    0.000    2.223    0.850
##     y2                2.794    0.408    6.850    0.000    2.794    0.717
##     y3                2.351    0.341    6.902    0.000    2.351    0.722
##     y4                2.812    0.324    8.677    0.000    2.812    0.846
##   dem65 =~
##     y5                2.103    0.256    8.210    0.000    2.103    0.808
##     y6                2.493    0.341    7.320    0.000    2.493    0.746
##     y7                2.691    0.319    8.441    0.000    2.691    0.824
##     y8                2.662    0.316    8.430    0.000    2.662    0.828
##
## Covariances:
##                    Estimate  Std.Err  z-value  P(>|z|)   Std.lv  Std.all
##  .y1 ~~
##    .y5                0.624    0.369    1.690    0.091    0.624    0.296
##  .y2 ~~
##    .y4                1.313    0.699    1.879    0.060    1.313    0.273
##    .y6                2.153    0.726    2.964    0.003    2.153    0.356
##  .y3 ~~
##    .y7                0.795    0.621    1.280    0.201    0.795    0.191
##  .y4 ~~
##    .y8                0.348    0.458    0.761    0.447    0.348    0.109
##  .y6 ~~
##    .y8                1.356    0.572    2.371    0.018    1.356    0.338
##   ind60 ~~
##     dem60             0.447    0.105    4.267    0.000    0.447    0.447
##     dem65             0.578    0.089    6.466    0.000    0.578    0.578
##   dem60 ~~
##     dem65             0.967    0.029   32.840    0.000    0.967    0.967
##
## Intercepts:
##                    Estimate  Std.Err  z-value  P(>|z|)   Std.lv  Std.all
##    .x1                5.054    0.084   60.127    0.000    5.054    6.943
##    .x2                4.792    0.173   27.657    0.000    4.792    3.194
##    .x3                3.558    0.161   22.066    0.000    3.558    2.548
##    .y1                5.465    0.302   18.104    0.000    5.465    2.090
##    .y2                4.256    0.450    9.461    0.000    4.256    1.093
##    .y3                6.563    0.376   17.460    0.000    6.563    2.016
##    .y4                4.453    0.384   11.598    0.000    4.453    1.339
##    .y5                5.136    0.301   17.092    0.000    5.136    1.974
##    .y6                2.978    0.386    7.717    0.000    2.978    0.891
##    .y7                6.196    0.377   16.427    0.000    6.196    1.897
##    .y8                4.043    0.371   10.889    0.000    4.043    1.257
##     ind60             0.000                               0.000    0.000
##     dem60             0.000                               0.000    0.000
##     dem65             0.000                               0.000    0.000
##
## Variances:
##                    Estimate  Std.Err  z-value  P(>|z|)   Std.lv  Std.all
##    .x1                0.082    0.020    4.136    0.000    0.082    0.154
##    .x2                0.120    0.070    1.712    0.087    0.120    0.053
##    .x3                0.467    0.089    5.233    0.000    0.467    0.239
##    .y1                1.891    0.469    4.035    0.000    1.891    0.277
##    .y2                7.373    1.346    5.479    0.000    7.373    0.486
##    .y3                5.067    0.968    5.233    0.000    5.067    0.478
##    .y4                3.148    0.756    4.165    0.000    3.148    0.285
##    .y5                2.351    0.489    4.810    0.000    2.351    0.347
##    .y6                4.954    0.895    5.532    0.000    4.954    0.443
##    .y7                3.431    0.728    4.715    0.000    3.431    0.322
##    .y8                3.254    0.707    4.603    0.000    3.254    0.315
##     ind60             1.000                               1.000    1.000
##     dem60             1.000                               1.000    1.000
##     dem65             1.000                               1.000    1.000
##    name idx nobs    type exo user  mean    var nlev lnam
## 1    x1   9   75 numeric   0    0 5.054  0.537    0
## 2    x2  10   75 numeric   0    0 4.792  2.282    0
## 3    x3  11   75 numeric   0    0 3.558  1.976    0
## 4    y1   1   75 numeric   0    0 5.465  6.879    0
## 5    y2   2   75 numeric   0    0 4.256 15.580    0
## 6    y3   3   75 numeric   0    0 6.563 10.764    0
## 7    y4   4   75 numeric   0    0 4.453 11.219    0
## 8    y5   5   75 numeric   0    0 5.136  6.826    0
## 9    y6   6   75 numeric   0    0 2.978 11.375    0
## 10   y7   7   75 numeric   0    0 6.196 10.799    0
## 11   y8   8   75 numeric   0    0 4.043 10.534    0
##      lhs op rhs    mi    epc sepc.lv sepc.all sepc.nox
## 52 ind60 =~  y4 4.796  0.577   0.577    0.174    0.174
## 53 ind60 =~  y5 4.456  0.559   0.559    0.215    0.215
## 70 dem65 =~  y4 4.260  2.986   2.986    0.898    0.898
## 99    y1 ~~  y3 3.771  0.849   0.849    0.274    0.274
## 74    x1 ~~  y2 3.040 -0.155  -0.155   -0.200   -0.200
SEM
Summary Output
Model Significance
|
Sample.Size
|
Chi.Square
|
df
|
p.value
|
|
75
|
37.617
|
35
|
0.35
|
Model Fit Measures
|
CFI
|
RMSEA
|
RMSEA.Lower
|
RMSEA.Upper
|
AIC
|
BIC
|
|
0.996
|
0.032
|
0
|
0.091
|
3179.582
|
3276.916
|
Factor Loadings
|
|
|
Loadings
|
|
|
Latent Factor
|
Indicator
|
Standardized
|
Unstandardized
|
SE
|
z
|
sig
|
|
ind60
|
x1
|
0.920
|
1.000
|
0.000
|
|
|
|
ind60
|
x2
|
0.973
|
2.180
|
0.140
|
15.580
|
***
|
|
ind60
|
x3
|
0.872
|
1.819
|
0.153
|
11.869
|
***
|
|
dem60
|
y1
|
0.850
|
1.000
|
0.000
|
|
|
|
dem60
|
y2
|
0.717
|
1.257
|
0.187
|
6.730
|
***
|
|
dem60
|
y3
|
0.722
|
1.058
|
0.149
|
7.083
|
***
|
|
dem60
|
y4
|
0.846
|
1.265
|
0.152
|
8.335
|
***
|
|
dem65
|
y5
|
0.808
|
1.000
|
0.000
|
|
|
|
dem65
|
y6
|
0.746
|
1.186
|
0.173
|
6.873
|
***
|
|
dem65
|
y7
|
0.824
|
1.280
|
0.161
|
7.925
|
***
|
|
dem65
|
y8
|
0.828
|
1.266
|
0.164
|
7.704
|
***
|
Regression Paths
|
DV
|
Predictor
|
Beta
|
B
|
SE
|
z
|
sig
|
|
dem60
|
ind60
|
0.447
|
1.483
|
0.400
|
3.708
|
***
|
|
dem65
|
ind60
|
0.182
|
0.572
|
0.235
|
2.432
|
|
|
dem65
|
dem60
|
0.885
|
0.837
|
0.099
|
8.419
|
***
|
Latent Factor Correlations
|
Factor 1
|
Factor 2
|
r
|
sig
|
|
R-Squared Values
|
Variable
|
R-Squared
|
|
x1
|
0.8461294
|
|
x2
|
0.9467924
|
|
x3
|
0.7606258
|
|
y1
|
0.7232244
|
|
y2
|
0.5142639
|
|
y3
|
0.5217888
|
|
y4
|
0.7152247
|
|
y5
|
0.6528919
|
|
y6
|
0.5565269
|
|
y7
|
0.6784379
|
|
y8
|
0.6853214
|
|
dem60
|
0.1995524
|
|
dem65
|
0.9609950
|
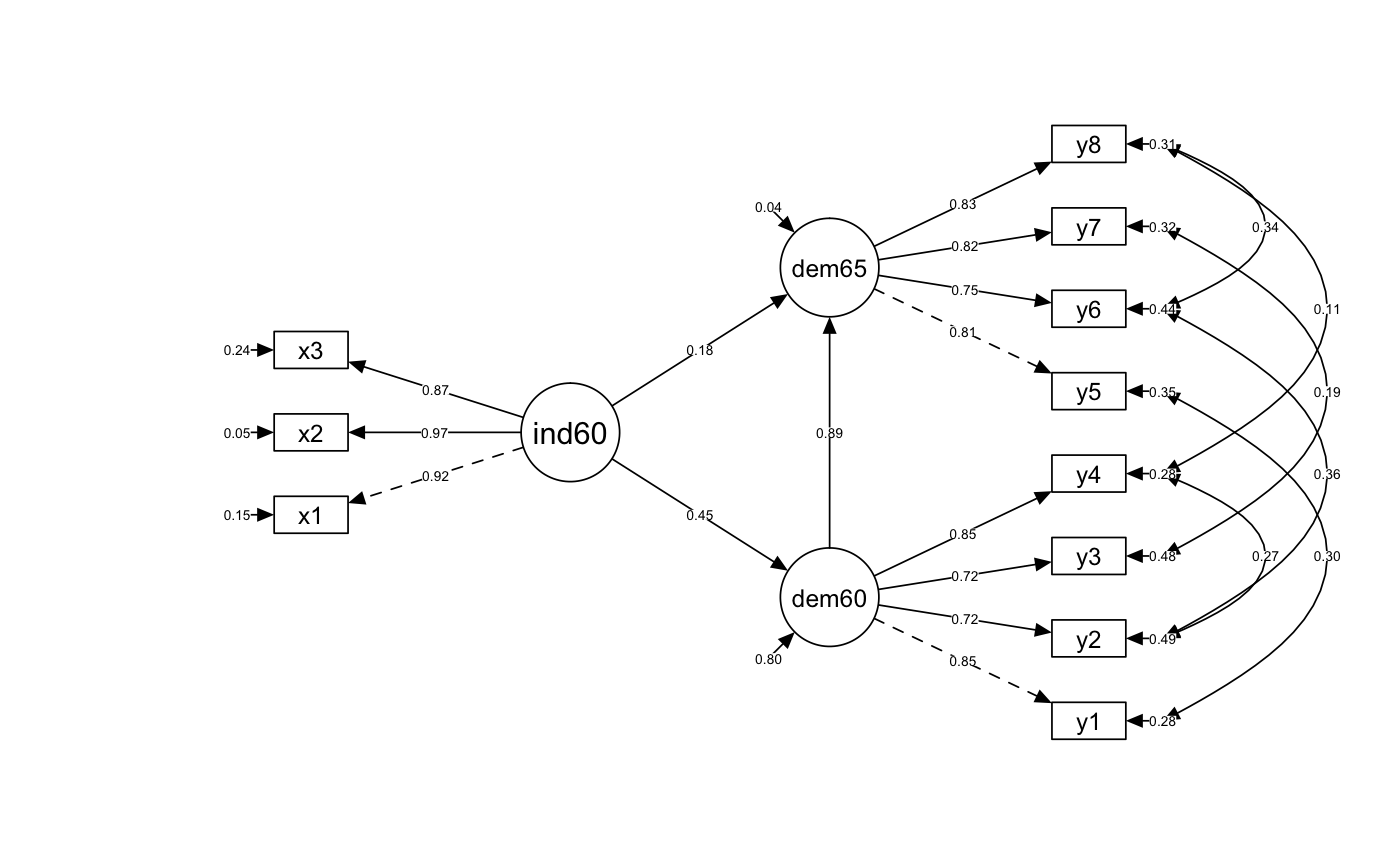
Diagram Output
semPaths(fit, whatLabels = "std", edge.label.cex = .5, layout = "tree2", rotation = 2, style = "lisrel", intercepts = FALSE, residuals = TRUE, curve = 1, curvature = 3, nCharNodes = 8, sizeMan = 6, sizeMan2 = 3, optimizeLatRes = TRUE, edge.color = "#000000", latents = factors)
Residual Correlation Matrix
|
|
x1
|
x2
|
x3
|
y1
|
y2
|
y3
|
y4
|
y5
|
y6
|
y7
|
y8
|
|
x1
|
|
|
|
|
|
|
|
|
|
|
|
|
x2
|
0.00
|
|
|
|
|
|
|
|
|
|
|
|
x3
|
0.00
|
0.00
|
|
|
|
|
|
|
|
|
|
|
y1
|
0.03
|
-0.05
|
-0.09
|
|
|
|
|
|
|
|
|
|
y2
|
-0.08
|
-0.06
|
-0.07
|
0.00
|
|
|
|
|
|
|
|
|
y3
|
0.03
|
0.00
|
-0.06
|
0.06
|
-0.06
|
|
|
|
|
|
|
|
y4
|
0.12
|
0.08
|
0.06
|
-0.03
|
0.02
|
0.00
|
|
|
|
|
|
|
y5
|
0.13
|
0.07
|
0.02
|
-0.02
|
-0.01
|
0.01
|
-0.01
|
|
|
|
|
|
y6
|
-0.05
|
-0.06
|
-0.04
|
0.04
|
0.03
|
-0.09
|
0.05
|
-0.04
|
|
|
|
|
y7
|
-0.05
|
-0.06
|
-0.06
|
-0.01
|
0.01
|
0.00
|
0.01
|
0.01
|
0.00
|
|
|
|
y8
|
0.02
|
-0.01
|
-0.05
|
-0.01
|
0.04
|
-0.05
|
0.03
|
-0.04
|
0.01
|
0.03
|
|
Full Output
## lavaan 0.6-3 ended normally after 83 iterations
##
##   Optimization method                           NLMINB
##   Number of free parameters                         42
##
##   Number of observations                            75
##   Number of missing patterns                         1
##
##   Estimator                                         ML
##   Model Fit Test Statistic                      37.617
##   Degrees of freedom                                35
##   P-value (Chi-square)                           0.350
##
## Model test baseline model:
##
##   Minimum Function Test Statistic              720.912
##   Degrees of freedom                                55
##   P-value                                        0.000
##
## User model versus baseline model:
##
##   Comparative Fit Index (CFI)                    0.996
##   Tucker-Lewis Index (TLI)                       0.994
##
## Loglikelihood and Information Criteria:
##
##   Loglikelihood user model (H0)              -1547.791
##   Loglikelihood unrestricted model (H1)      -1528.728
##
##   Number of free parameters                         42
##   Akaike (AIC)                                3179.582
##   Bayesian (BIC)                              3276.916
##   Sample-size adjusted Bayesian (BIC)         3144.543
##
## Root Mean Square Error of Approximation:
##
##   RMSEA                                          0.032
##   90 Percent Confidence Interval          0.000  0.091
##   P-value RMSEA <= 0.05                          0.629
##
## Standardized Root Mean Square Residual:
##
##   SRMR                                           0.041
##
## Parameter Estimates:
##
##   Information                                 Observed
##   Observed information based on                Hessian
##   Standard Errors                             Standard
##
## Latent Variables:
##                    Estimate  Std.Err  z-value  P(>|z|)   Std.lv  Std.all
##   ind60 =~
##     x1                1.000                               0.670    0.920
##     x2                2.180    0.140   15.580    0.000    1.460    0.973
##     x3                1.819    0.153   11.869    0.000    1.218    0.872
##   dem60 =~
##     y1                1.000                               2.223    0.850
##     y2                1.257    0.187    6.730    0.000    2.794    0.717
##     y3                1.058    0.149    7.083    0.000    2.351    0.722
##     y4                1.265    0.152    8.335    0.000    2.812    0.846
##   dem65 =~
##     y5                1.000                               2.103    0.808
##     y6                1.186    0.173    6.873    0.000    2.493    0.746
##     y7                1.280    0.161    7.925    0.000    2.691    0.824
##     y8                1.266    0.164    7.704    0.000    2.662    0.828
##
## Regressions:
##                    Estimate  Std.Err  z-value  P(>|z|)   Std.lv  Std.all
##   dem60 ~
##     ind60             1.483    0.400    3.708    0.000    0.447    0.447
##   dem65 ~
##     ind60             0.572    0.235    2.432    0.015    0.182    0.182
##     dem60             0.837    0.099    8.419    0.000    0.885    0.885
##
## Covariances:
##                    Estimate  Std.Err  z-value  P(>|z|)   Std.lv  Std.all
##  .y1 ~~
##    .y5                0.624    0.371    1.679    0.093    0.624    0.296
##  .y2 ~~
##    .y4                1.313    0.703    1.867    0.062    1.313    0.273
##    .y6                2.153    0.731    2.944    0.003    2.153    0.356
##  .y3 ~~
##    .y7                0.795    0.625    1.271    0.204    0.795    0.191
##  .y4 ~~
##    .y8                0.348    0.461    0.755    0.450    0.348    0.109
##  .y6 ~~
##    .y8                1.356    0.576    2.355    0.019    1.356    0.338
##
## Intercepts:
##                    Estimate  Std.Err  z-value  P(>|z|)   Std.lv  Std.all
##    .x1                5.054    0.085   59.724    0.000    5.054    6.943
##    .x2                4.792    0.174   27.472    0.000    4.792    3.194
##    .x3                3.558    0.162   21.918    0.000    3.558    2.548
##    .y1                5.465    0.304   17.983    0.000    5.465    2.090
##    .y2                4.256    0.453    9.398    0.000    4.256    1.093
##    .y3                6.563    0.378   17.344    0.000    6.563    2.016
##    .y4                4.453    0.386   11.520    0.000    4.453    1.339
##    .y5                5.136    0.303   16.977    0.000    5.136    1.974
##    .y6                2.978    0.389    7.665    0.000    2.978    0.891
##    .y7                6.196    0.380   16.317    0.000    6.196    1.897
##    .y8                4.043    0.374   10.816    0.000    4.043    1.257
##     ind60             0.000                               0.000    0.000
##    .dem60             0.000                               0.000    0.000
##    .dem65             0.000                               0.000    0.000
##
## Variances:
##                    Estimate  Std.Err  z-value  P(>|z|)   Std.lv  Std.all
##    .x1                0.082    0.020    4.109    0.000    0.082    0.154
##    .x2                0.120    0.070    1.701    0.089    0.120    0.053
##    .x3                0.467    0.090    5.198    0.000    0.467    0.239
##    .y1                1.891    0.472    4.008    0.000    1.891    0.277
##    .y2                7.373    1.355    5.442    0.000    7.373    0.486
##    .y3                5.067    0.975    5.198    0.000    5.067    0.478
##    .y4                3.148    0.761    4.137    0.000    3.148    0.285
##    .y5                2.351    0.492    4.778    0.000    2.351    0.347
##    .y6                4.954    0.901    5.495    0.000    4.954    0.443
##    .y7                3.431    0.733    4.683    0.000    3.431    0.322
##    .y8                3.254    0.712    4.572    0.000    3.254    0.315
##     ind60             0.448    0.087    5.135    0.000    1.000    1.000
##    .dem60             3.956    0.951    4.160    0.000    0.800    0.800
##    .dem65             0.172    0.222    0.778    0.437    0.039    0.039
##      lhs op rhs    mi    epc sepc.lv sepc.all sepc.nox
## 52 ind60 =~  y4 4.796  0.862   0.577    0.174    0.174
## 53 ind60 =~  y5 4.456  0.835   0.559    0.215    0.215
## 70 dem65 =~  y4 4.260  1.420   2.986    0.898    0.898
## 99    y1 ~~  y3 3.771  0.849   0.849    0.274    0.274
## 74    x1 ~~  y2 3.040 -0.155  -0.155   -0.200   -0.200